Posts

How to correct Scanline Error/Banding in Landsat 7 images

Image
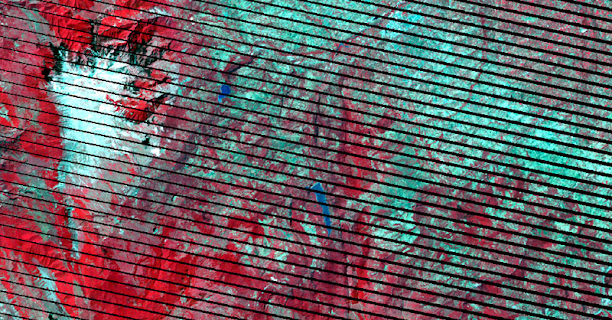
If you want to correct for banding in Landsat 7 images, the USGS has a  system for correcting  Landsat 7 satellite images. Although there are several methods based on interpolation, you can resort to a simple tool with the help of the Landsat Toolbox for ArcGIS. If Landsat 7 images are recognizable for something, it is because of their satellite image banding problems, generating gaps or lines of absence of information with a slight inclination towards the sides while the central area is displayed correctly.  An error that generates missing data by displaying the image through banding of stripes or lines parallel to each other.  Something that, even though it is typical of Landsat 7, also occurs in some images from other space missions due to radiometric errors and that can be corrected in a similar way. Landsat Toolbox developed by the Washington State Department of Transportation (WSDOT).  Within this simple toolbox you will find several applications and the o...

Global Climate Data Download

Image
Perhaps one of the most difficult information to obtain is  climate mapping  based on values ​​of temperature, precipitation or humidity.  Usually, this little information is found in raster format or in simple data tables.  And although the information may be scarce on the Internet, there are places to obtain this type of data.  Let's see where we can download climate cartography. Worldwide we find some places to download climate cartography.  WorldClim  is a possible resource where you can download climatic data in Raster format of 19 climatic variables worldwide and at different resolution levels.  It provides  climate information under three potential scenarios: present, past and future, being able to use this latest information (CMIP5 model) for future modeling projects in the face of climate change. The  Global Climate Monitor  is also another option that we can use to obtain climate information.  From this interesting pl...

Hillshade, slope maps, DEMs and 3D orthophotos

Image
When one is a beginner and gets into the world of the exploitation of Digital Terrain Models, or DTM, the first doubts and confusions assail about what is a slope map, a shadow map, a Digital Elevation Model and an image visualized in 3D.  Do we see the differences between them to understand each other? Digital  elevation  models,  or DEMs, allow altitude values ​​to be represented by pixels (when we are using GRID files).  Each pixel shows an altitude value, and, with the help of cartographic software, we can visualize the complete model in 3D noting the morphology of the terrain.  Once we represent the model in a three-  dimensional environment   we will be able to visualize the geography noting the slopes, valleys, valleys, mountains or any geographical feature of the territory thanks to the sensation of depth.  These models only represent altitude values, concepts such as depth, slope orientation or shadows are determined by the position ...

Sentinel 2 Satellite Imagery Free Download

Image
For those who are not familiar with it, I present to you Sentinel 2, one of the many satellite  that orbit over us with an interesting mission: monitoring of environmental factors through  aerial images .  An interesting resource that you can use in your GIS analysis to illustrate territorial zones through full color images and for free. If you're a bit lost and still don't know much about Sentinel 2, you can start by getting to know all its technical features, download resources, bands, indexes, resolutions and management tools in detail  from this link .  A general review of everything that surrounds Sentinel 2 will help you understand terminology and the background of its images. Sentinel 2A is the first of the twins launched into space that is already providing us with free satellite images from anywhere in the world together with its brother Sentinel 2B.  This satellite of just over a ton has the mission of capturing images thanks to its  13 band...

Fun with maps

Image
The cartographer's life is hard, especially working with  projections , but when it's time to enjoy there is nothing better than working with fun cartographic viewers to unleash our imagination.  Countless official viewers have gone through the “  cover  ” and the “  tuning  ”.  One of the most prostituted viewers in this regard is  Google Maps  .  Others simply show some fun aspect or documentary to inform us and pass the time.  Here are some of my favorite fun cartographic viewers. NORSE:   This viewer allows you to view the planet's cyberattacks, showing the countries of origin and destination of the attack.  Through the control panel you can see the most punished countries, the IP of the attackers and the countries involved in the attack. STAR WARS STREET VIEW:   The viewer most used by lovers of the  Star Wars  saga.  A Street View with three  tuning  modes to generate three views from th...

Main geoprocessing tools in GIS

Image
We can define  Geoprocessing  or  Geoprocessing  as a set of procedures aimed at establishing relationships and analysis between two or more layers.  In general, these processes are carried out through two-layer analysis, although in some cases it is possible to operate with only one or with more than two at the same time.  As a result of the combination of the initial layers, we obtain a new layer that shows spatial information associated with the initial layers. The main geoprocessing or geoprocessing tools that we will find in any GIS program enabled for it are: Dissolve:  Through this operation we can dissolve the limits between elements and unify entities from the same layer as long as they present a common attribute or value in their attribute table.  For this it is necessary that these cartographic entities present in the attribute table a field under which the same attribute is repeated.  Graphically we could represent it as follows....

Maxent tool for ArcGIS Pro in species modeling

Image
The Maxent tool for ArcGIS Pro is now available starting with versions 2.9.  The mythical species distribution modeling tool already has a clone within the ArcGIS Pro geoprocessing tools, and you will not need to complicate the adaptation of variables and coordinates that Maxent originally requires.  From your coordinates and variables, whatever your starting conditions, you can carry out the modeling of species. From the analysis tools you can access the  Presence-only Prediction (Maxent) tool,  an emulation of the original tool within the ArcGIS Pro environment that does not require the addition of auxiliary toolboxes or direct gateways to the .JAR executable. The tool presents the same parameterization as Maxent, having to incorporate the raster environmental variables and the distribution coordinates.  What is interesting about the tool?  That you will not need  to adapt the data to Maxent's requirements by  managing pixel sizes, generating CS...